Automated plant data capture
The problem
A biogas or biofuel plant generates the evidence a traceability or MRV scheme needs: digester feed rates, gas flows, methane content, flare events, power export, feedstock receipts. Most of it already exists as tags inside the plant controller. Today that data reaches a certifier through monthly spreadsheets, manual meter reads and screenshots. The numbers are late, hard to audit, and easy to adjust after the fact.
There is also an incentive problem that auditors know well. The operator who records a figure is usually the one measured against it. When a monthly number feeds a yield, uptime or availability KPI, a bonus, or a compliance threshold, the figure that gets written down tends to be the one the target needs rather than the one the plant produced. A reading transcribed by hand can be rounded up, back-filled across a gap, or quietly smoothed, and nothing in the spreadsheet shows that it was. The POME fat-pit problem is the same failure in another form: data that is reported by the people whose performance it judges.
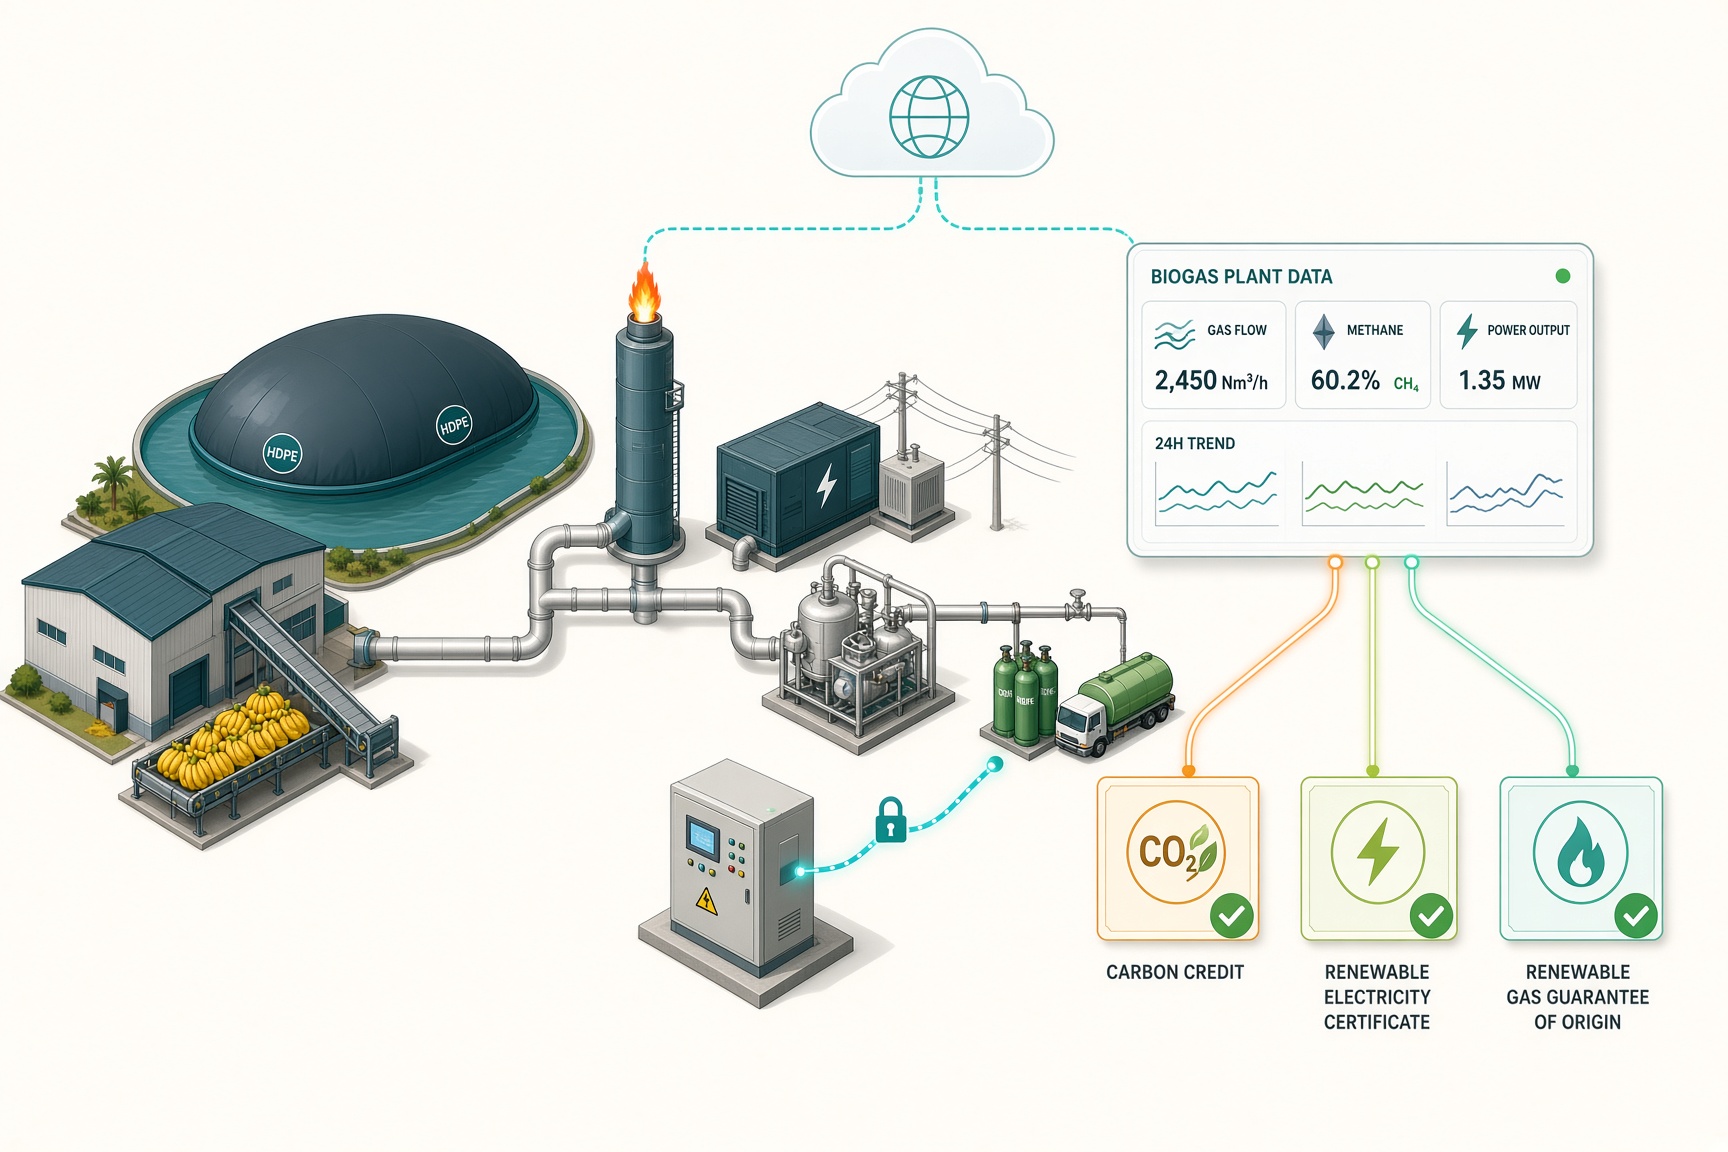
BioJejak reads the agreed tags straight from the plant controller, on a fixed interval, and timestamps each value at source. The same reading that drives the operator's own screens becomes the reading behind the sustainability claim. Nobody re-keys it, so there is no point between the meter and the report at which a number can be shaped to fit a target.
How the controller is read
The approach is specific to how a Siemens S7-1500 actually exposes its data, and it avoids the two methods that look convenient but do not hold up.
Profinet is the plant's I/O network, the cyclic exchange between the CPU and its field devices. A data-gathering PC does not join that exchange to collect historian values. What matters for data capture are the names the plant was engineered with: the TIA Portal tag names and the data-block member names. Those are the labels an operator and an auditor both recognise.
The S7-1500 publishes those names on its built-in OPC UA server, for every tag marked Accessible from HMI/OPC UA/Web API. BioJejak connects to that server as a read-only OPC UA client, browses the namespace, and subscribes to the agreed tags by name. OPC UA carries its own authentication, signing and encryption, so the link is secured end to end and the connection can be scoped to read only.
What this gives the scheme
- Values tied to engineered tag names, so an auditor can trace a reported figure back to the exact point in the plant it came from.
- A timestamp set at the controller, not at the point of data entry, so the record is defensible.
- A fixed capture interval, so gaps and flare or downtime events are visible rather than smoothed away in a monthly total.
- A read-only, encrypted path that an operator's OT team can review and approve, with no write access to the control system.
The result is a feedstock and production record that is continuous, named, timestamped and secured from the controller onward, which is the record a traceability claim or a carbon methodology actually has to stand on.
Turning the tags into carbon numbers
A POME biogas project earns credits under CDM methodologies such as AMS-III.H (methane recovery in wastewater treatment) or ACM0014 (treatment of wastewater) for large plants, with electricity export handled under AMS-I.D. Verra's VCS uses the same calculation structure. In all of them the emission reduction is baseline emissions minus project emissions minus leakage, and each of those terms rests on a quantity the plant controller already holds.
The quantity everything else builds on is the methane actually captured and sent to destruction. That comes from two tags: the biogas flow meter and the methane analyser. Flow in normal cubic metres, multiplied by the measured CH4 fraction and the interval, gives the mass of methane routed to the flare or the engine, logged continuously rather than read off a gauge once a month.
Digester and capture leakage
Project (physical) leakage is the methane the system generates but fails to capture, the share that escapes the cover or the digester before it reaches the meter. A flow meter cannot measure gas that never passes it, so this term is never read directly off a single tag. What the controller does is pin down the two things that let you defend a real leakage figure instead of accepting the methodology's conservative default capture efficiency:
- The metered captured volume, continuously, as the measured side of the balance against the baseline methane generation estimated from the organic load.
- The operating evidence that the capture system held: cover or headspace pressure, digester temperature, and relief or pressure-relief-valve status. A slumped cover or a relief-valve lift is a leak event, and a continuous pressure and temperature log turns "we assume 90% capture" into an evidenced record of when capture was intact and when it was not.
So the honest claim is that the controller does not meter the leak itself. It quantifies capture and documents capture-system integrity, which is what moves the leakage term off a default and onto measured data.
Methane destruction by flaring
Flaring is governed by the CDM Tool to determine project emissions from flaring gases containing methane. The tool does not assume a flare works. It runs hour by hour: in any hour the flare's combustion-chamber temperature sits above its threshold, destruction is credited at the flare's efficiency (a typical enclosed-flare default of about 90%, to confirm against the current tool version or replace with a measured value); in any hour the temperature drops below threshold, the flame is treated as out and that hour's gas counts as released in full.
That hourly temperature test is controller data by nature. The tags that feed it are the flare gas flow, the CH4 content, the flare combustion-chamber temperature, and the pilot or flame-detection status. Capturing them at a fixed short interval does two things a monthly total cannot: it applies the tool's efficiency test at the resolution the tool actually specifies, and it makes every flame-out period visible instead of smoothing it into an apparently healthy month. The destruction credit becomes a measured result rather than an assumption.
Methane destruction in a biogas genset
When the biogas goes to an engine instead of the flare, two credits run at once and both trace to tags. The methane burned in the engine is destroyed much as it is in a flare, at a high engine destruction efficiency, with any uncombusted methane slip in the exhaust carried as a project emission per the methodology. Separately, the electricity the engine exports displaces grid power, which is credited under AMS-I.D as net electricity exported multiplied by the grid emission factor.
The tags are the export power meter in kilowatt-hours, the engine running status, the biogas flow to the engine, and the CH4 content. The running status matters for more than uptime: a plant that both flares and generates has to split its biogas between the two legs without crediting the same cubic metre twice. Continuous flow on each leg, tied to engine run status, gives an auditable split and closes the double-counting gap that monthly estimates leave open.
Across all three routes the pattern is the same. The methodology asks for a methane quantity, a destruction efficiency, or an exported quantity of energy, and the controller is already measuring the flow, the composition, the temperature, the pressure and the power that those terms are built from. BioJejak's job is to read them by name, timestamp them at source, and present them in the form the methodology's monitoring plan requires.
From measured data to the instrument
The same verified data is what an issuing registry needs to mint the instrument a project actually sells, and which instrument depends on what the biogas is used for. Each route is measured in its own unit, and each unit traces back to the same tags.
- Flaring. Methane that would otherwise vent is destroyed, and that destruction is issued as carbon credits, for example VCUs under Verra's VCS or CERs under CDM. The basis is tonnes of CO2e, from the biogas flow, the CH4 fraction and the hourly flare efficiency.
- Electricity. Biogas burned in the genset exports power. Each megawatt-hour can be issued as a renewable electricity certificate, an I-REC across most of Southeast Asia or a Guarantee of Origin in Europe, or, where the project credits avoided grid emissions instead, as carbon credits under AMS-I.D. The export meter is the basis either way, and the same megawatt-hour cannot be both: the REC and the carbon credit represent one attribute, claimed once.
- Gas to grid or vehicle fuel. Biogas upgraded to biomethane and injected to the grid, or compressed to bio-CNG or liquefied to bio-LNG, is issued as a Renewable Gas Guarantee of Origin (RGGO). The basis is the energy delivered, from the grid-injection or dispatch meter and the measured calorific value.
A given quantity of biogas meets only one of these fates. It is flared, burned for power, or upgraded and delivered. Metering the flow on each route is therefore what stops a carbon credit, a REC and an RGGO being issued against the same gas. Per-tag, timestamped data is what lets each unit be allocated to one route and one instrument, and defended when a registry or an auditor asks to see the trail.